Drought Dashboard
interventions_12.html
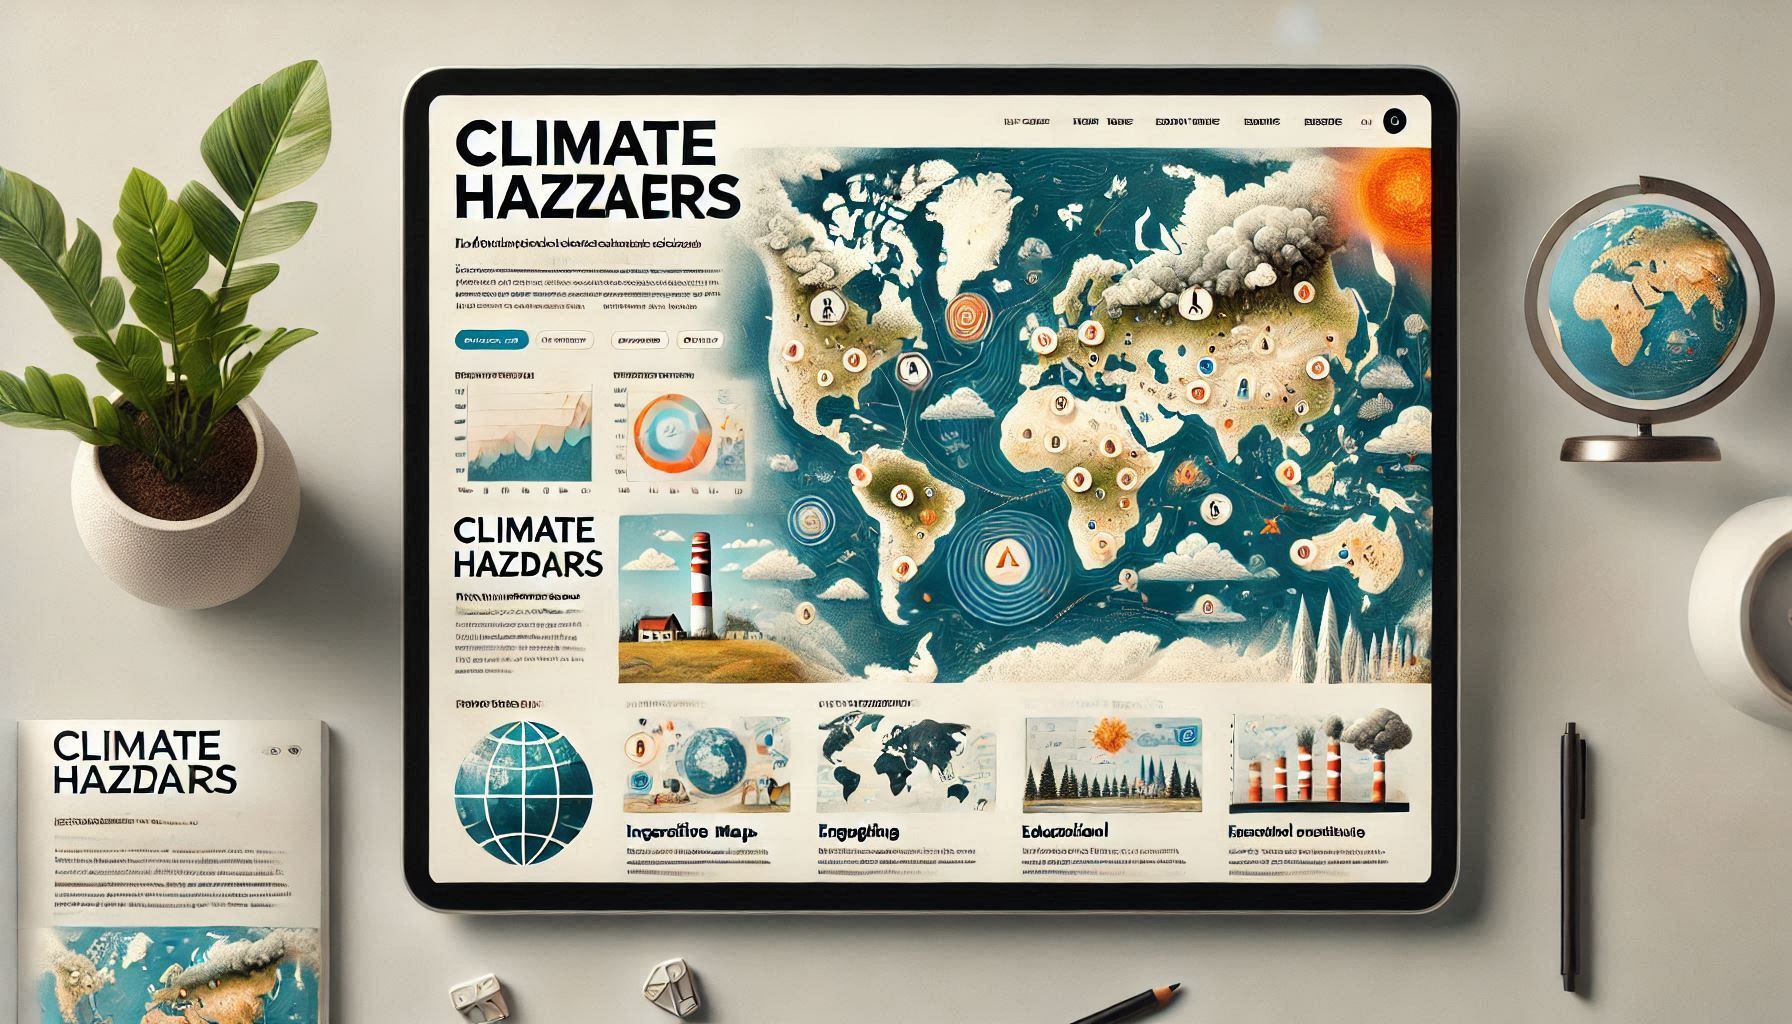
A drought dashboard is a digital tool that provides real-time data, visualisations, and forecasts on drought conditions. It helps governments, farmers, water managers, and researchers monitor and respond to drought events effectively.
Key Features of a Drought Dashboard:
- Real-Time Drought Monitoring – Tracks rainfall deficits, soil moisture, and water availability.
- Satellite & Sensor Data Integration – Uses satellite images, weather stations, and IoT sensors to analyse drought conditions.
- Drought Forecasting & Early Warning – Predicts future drought risks based on climate models.
- Water Resource Management Tools – Displays reservoir levels, river flows, and groundwater status.
- Impact Assessment & Response Planning – Helps policymakers and farmers take preventive measures.
Benefits
- Early Warning & Risk Reduction – Alerts communities before droughts intensify.
- Informed Decision-Making – Assists farmers, industries, and governments in water management.
- Better Resource Allocation – Helps prioritise water supply during drought conditions.
- Climate Adaptation & Resilience – Supports long-term strategies to cope with changing rainfall patterns.
- Public Awareness & Education – Provides accessible information on drought severity and mitigation.
Criticism or Limitations
- Data Gaps & Accuracy Issues – Limited historical data in some regions affects prediction accuracy.
- Technical & Financial Barriers – Requires investment in monitoring systems and infrastructure.
- Dependence on Internet & Power Supply – Some remote areas may struggle with connectivity.
- Complex Interpretation – Users may need training to understand climate models and data trends.
Real-life examples in the EU
ARSINOE Case Studies