Biodiversity Dashboard
interventions_05.html
A biodiversity dashboard is a digital tool that collects, visualises, and tracks biodiversity data to help researchers, policymakers, and the public monitor ecosystem health and conservation efforts
Key Features of a Biodiversity Dashboard:
- Species Monitoring: Tracks populations of plants, animals, and microorganisms in specific regions.
- Habitat & Land Use Data: Shows how land use changes (e.g., deforestation, urbanization) impact ecosystems
- Climate & Environmental Indicators: Includes temperature, pollution levels, and climate-related threats.
- Conservation Status: Displays protection efforts, endangered species lists, and habitat restoration progress.
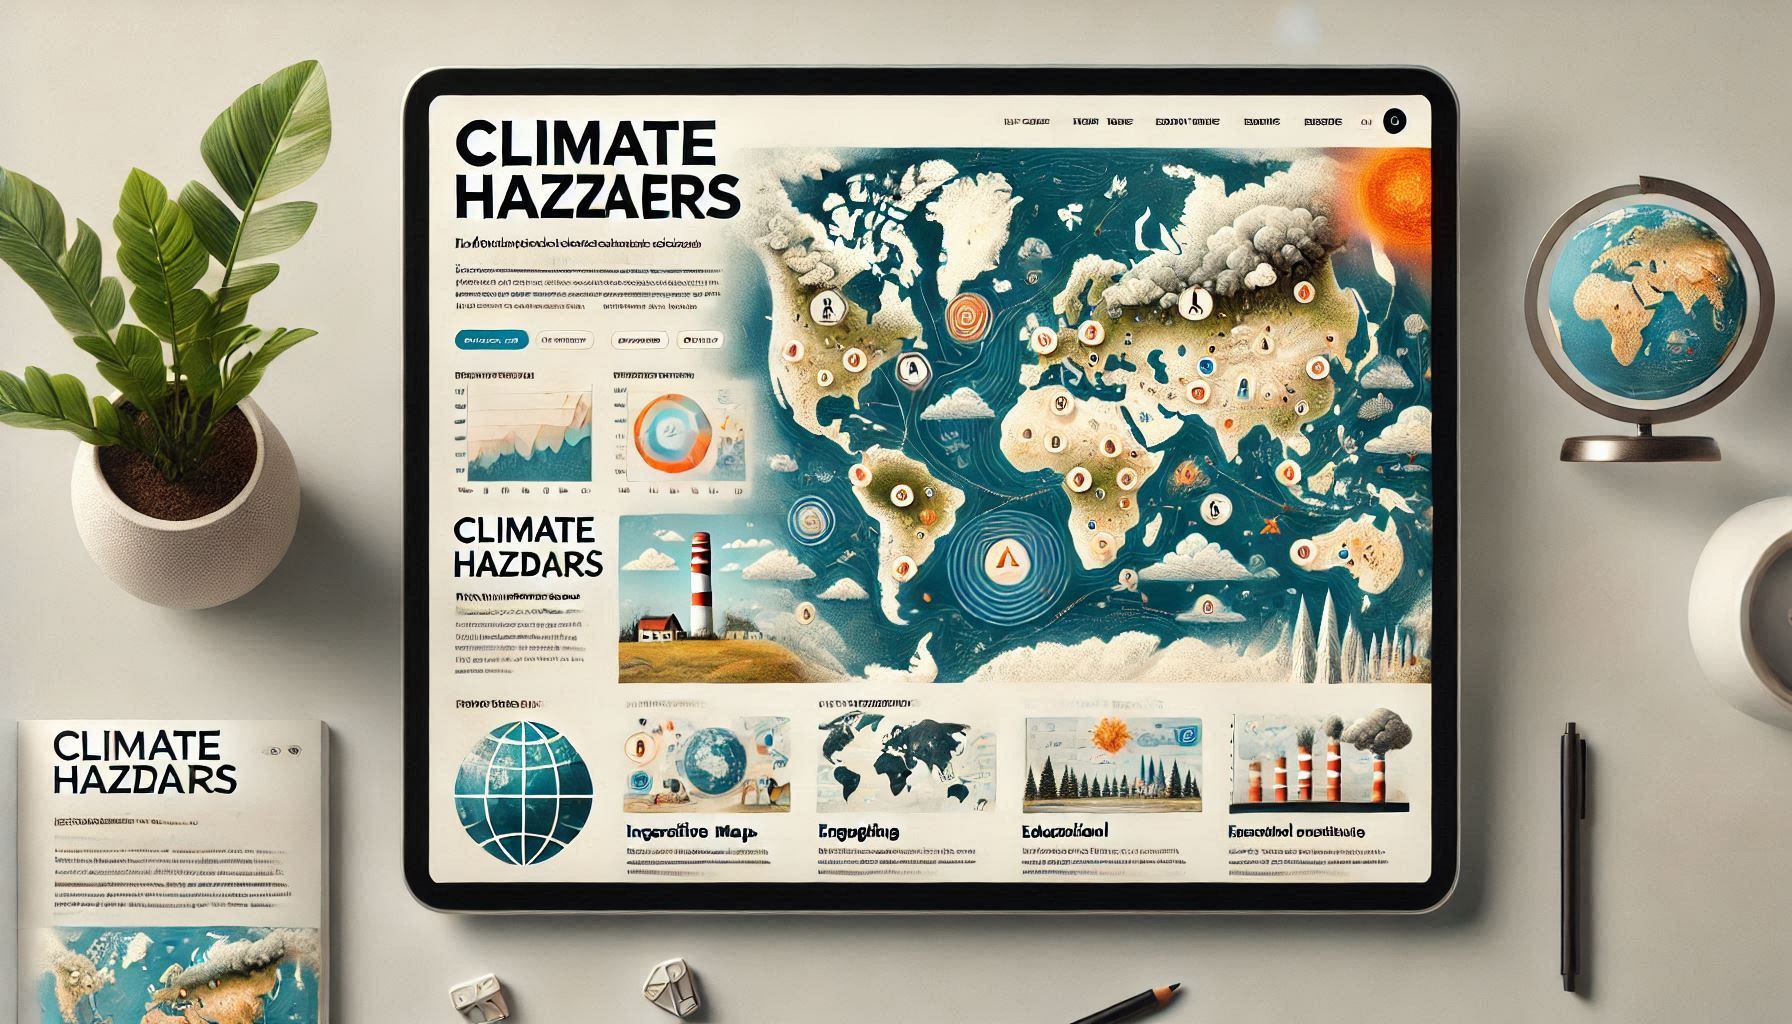
- Interactive Maps & Visuals: Uses GIS (Geographic Information System) to map biodiversity trends.
- Public & Scientific Contributions: Integrates citizen science data from platforms like iNaturalist or eBird.
Benefits
- Data-Driven Decision Making: Helps policymakers, conservationists, and researchers track biodiversity trends and make informed choices.
- Real-Time Monitoring: Provides up-to-date information on species populations, habitat changes, and environmental threats.
- Public Engagement & Citizen Science: Allows communities to contribute data, increasing awareness and involvement in conservation efforts.
- Early Warning System: Helps detects biodiversity loss, habitat destruction, and invasive species before they become major threats.
- Supports Conservation Strategies: Helps prioritise areas for protection, restoration, and sustainable land management.
- Visual & Interactive Insights: Uses maps, charts, and analytics to make biodiversity data easy to understand and accessible.
Criticism or Limitations
- Data Gaps & Inaccuracy: Incomplete or outdated datasets can lead to misleading conclusions.
- Limited Regional Coverage: Some dashboards focus on global trends and may lack detailed local biodiversity data.
- Technical Complexity: Requires expertise to interpret complex ecological data and make policy-relevant conclusions.
- Dependence on Funding & Maintenance: Continuous updates and technological support are needed to keep dashboards relevant.
- Variation in Data Quality: Crowdsourced data from citizen science projects may lack consistency and scientific rigor.
- Lack of Integration: Some dashboards may not link effectively with other environmental monitoring systems.
Real-life examples in the EU
ARSINOE Case Studies